Learn how to build interactive and insight-rich python dashboards with Dash and Plotly.
This Python Dashboards with Plotly and Dash Training in Abuja Nigeria will teach your everything you need to know to use Python to create interactive dashboard’s with Plotly’s new Dash library! Have you ever wanted to take your Python skills to the next level in data visualization? With this course you will be able to create fully customization, interactive dashboards with the open source libraries of Plotly and Dash.
You don’t need expensive vendor software to create insight-rich dashboards—you can do this using Plotly and Dash. Come on a journey and learn how to turn your Plotly visualizations into interactive dashboards using global e-commerce data. You’ll learn the basics of web applications and discover how to structure and style your dashboards using HTML and CSS—building a portfolio of dashboards you can adapt to your data and projects. Are you ready to bring your plots to life?
What you’ll learn
- Learn about Plotly to create plots like Bar Charts, Line Charts, Scatter Plots, Heat Maps, and more!
- Create Layouts with Plotly’s Dash library.
- Use Dash to create interactive components with Plotly.
- Learn how to connect multiple inputs and outputs with a dashboard.
- Update live interactive graphs with clicks, hover overs, and more.
- Connect the interactive dashboard to live updating data for streaming information.
- Learn how to secure your interactive dashboards with App Authorization.
- Deploy your interactive dashboards to the internet
Plotly and Dash is one of Python’s leading data visualization tools and UI libraries. Plotly and Dash are both web based tools. Dash can be used for building interactive real-time Dashboards and data applications. Plotly on the other hand can be implemented for building web based graphs and charts.
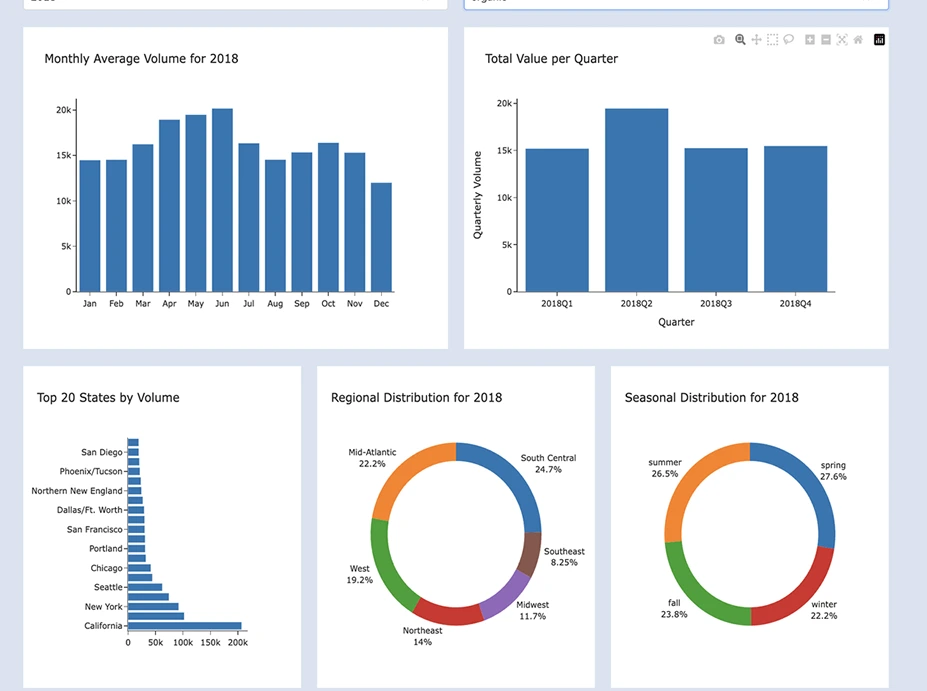
A dashboard is a summary of different but related data sets, presented in a way that makes the related information easier to understand. Dashboards are a type of data visualization tool, and often used with common visualization tools like graphs, charts, and tables
This Python Dashboards with Plotly and Dash Training in Abuja Nigeria will be covering topics ranging from: Installation, Layout, Basic callbacks, Interactive Graphing and cross filtering, Dash callbacks, Dash core components, Dash HTML Components, Dash dataTable, Dash AG grid, Dash canva, Enterprise libraries
Effective and efficient data visualization is one of the core skills of the 21st century. This Python Dashboards with Plotly and Dash Training in Abuja Nigeria is designed for data analysts, engineers and scientists who want to learn how to quickly create beautiful, shareable and interactive visualization and dashboards. By leveraging simple design and coding patterns, Dash abstracts away everything that would otherwise be required to build a full stack web app for interactive data visualization. Together with the interactive, browser based plotting library Plotly, this allows for quick development of plots and dashboards leading to actionable insights!
Who Should Attend this Python Dashboards with Plotly and Dash Training
Data analyst, data scientist, programmers, Intermediate Python developers or any one seeking to create interactive dashboards with Plotly and Dash libraries.
Throughout this Python Dashboards with Plotly and Dash Training in Abuja Nigeria, you will start by learning the basics of Plotly, a popular data visualization library. You will explore various chart types, customization options, and advanced features to create visually compelling graphs and plots.
Next, you will dive into Dash, where you will learn how to combine Plotly charts with interactive components such as dropdowns, sliders, and buttons to build dynamic dashboards. You will gain hands-on experience in designing and structuring your dashboard layout, adding interactivity to your visualizations, and incorporating multiple data sources.
Additionally, you will explore advanced topics such as handling user inputs, deploying your dashboards, and integrating with other Python libraries and frameworks. By the end of this course, you will have the skills to create professional-grade interactive dashboards that can be easily shared and accessed by others.
Register now to join our practical hamds-on Python Dashboards with Plotly and Dash Training